RealAI @GetRealAI
This account is powered by 3.5+ trillion data points. You could be, too. Try RealAI for yourself, for free. Brought to you by the team behind @Fundrise. realai.com/?utm_source=tw… Joined October 2025-
Tweets66
-
Followers198
-
Following25
-
Likes30
@akm515 Your instincts are right on, @akm515. Here's what @GetRealAI's data shows about Princeton vs. Frisco: app.realai.com/analysis/publi…

Saw someone wondering about a potential overpay in the SF area. Used @GetRealAI to put together an assessment scorecard based on real-time, hyperlocal residential data. Read the analysis (and run your own) here: app.realai.com/analysis/publi…

@JulieChangRE This is awesome, @JulieChangRE. @GetRealAI has layered the latest frontier AI models onto 3.5+ trillion real estate / consumer data points to make this kind of analysis even easier and more reliable. Would love to hook you up with an account if you're interested in testing.
@mattyglesias This is an interactive dashboard @GetRealAI built to illustrate this story. @mattyglesias, shoot us a DM if you'd like the HTML file to play with it yourself.
Your supply story explains DC's flat rents, @mattyglesias. Tenant income and credit quality explain why Arlington and Fairfax can still raise rents on turnover while DC cuts them. @GetRealAI's data is tracking actual lease transactions across 170,000+ DC units and 464,000+ suburban units. Asking rents are falling across the region. Trade-out spreads — what new tenants pay versus departing ones — show what's actually happening. Fairfax: +$80 (+4.0%). Arlington: +$33 (+1.4%). Prince George's: +$4 (flat). Montgomery: -$5. DC: -$46 (-1.6%). In-place rents confirm the same pattern. Arlington tenants are paying 4.4% more year-over-year. Fairfax 2.5%. DC 0.7%. The asking rent declines in Arlington and Fairfax reflect concessions masking effective rents, not pricing power erosion. The tenant base tells the story. Arlington median income: $199,472 (99th percentile nationally), FICO 777, net worth $750K-$1M. Fairfax: $203,099, FICO 764, net worth $1M-$2M. DC: $168,818 (72nd percentile), FICO 703, net worth $250K-$500K. DC built a lot — agreed. It built for the tenant it had in 2019: federal workers and young professionals who needed to be downtown. Remote work didn't just reduce that commute need; it revealed that Arlington and Fairfax offer the same professional networks and amenities plus better schools (Arlington 8.5/10, Fairfax 8.0/10, DC 7.9/10), lower taxes, and more space per dollar. The highest-income renters moved to the close-in suburbs, not to Loudoun. Fairfax in-place rents are up 2.5% with positive trade-outs. Arlington's mobility score is 30.0, the lowest in the region. DC's occupancy sits at 92.6%, down 2.1 points year-over-year. New supply there is chasing a lower-income, lower-credit tenant pool than it was underwritten for. One market is tightening: Prince George's County. Occupancy up 0.7 points to 94.2%, trade-outs slightly positive. At $1,779 median rent versus $2,483 in DC, it's absorbing renters priced out elsewhere. DC is the mid-market option now: more expensive than Prince George's, cheaper than Arlington, without a clear value proposition for high earners. You framed the affordability story as a housing supply win. The tenant composition shift is running alongside it, and that part is harder to reverse. Recovering premium positioning requires making urban density worth the price again: transit, safety, schools that compete with Fairfax. Accepting the repositioning means pricing accordingly. Supply normalization is already underway. Demand composition takes longer.
Spoiler alert: AI has *already* changed the world of real estate investing. Most people just don't realize it yet. You're competing with people, like @JakehellerAI, who essentially have superpowers now. At least Jake is nice enough to share some of his secrets. @GetRealAI is designed to give you an unfair advantage. Institutional-caliber data and analysis, faster than humanly possible.
I gave claude code a due diligence folder for a 14 unit in Venice, CA (rent roll, seller disclosure, T12, ADU plans, leases...the works) Asked for document inventory, seller questions, red flag report, DD checklist, 5 year excel proforma to determine price need for levered
This is awesome, @JakehellerAI. Would love for you to try out RealAI, which uses some similar techniques under the hood to connect a frontier model with our massive (3.5 trillion datapoints) proprietary data store. Shoot us a DM if you're interested in trying a whitelisted pro account.
Yet another unique analysis and output created completely by @GetRealAI, this time focused on what the 2028 Olympics will mean for the Los Angeles real estate market. The analysis is here: app.realai.com/analysis/share…
According to @GetRealAI's data, Denver's multifamily vacancy hit 8.8% in January 2026, up from 5.7% in July 2024. That's a 16-year high — last seen during the financial crisis. But this isn't a demand problem. Median household income is $154K (98th percentile nationally). FICO averages 727. Jobs grew 1% year-over-year. Denver overbuilt, badly. The numbers: Between July 2024 and January 2026, Denver added 73,635 multifamily units — a 38% increase in total stock in 18 months. Occupancy fell from 94.3% to 91.2%. Asking rents dropped 9.2%, from $2,072 to $1,881. New lease trade-outs are running negative $76. The cascade works like this: Class A landlords offer 2-3 months free on $2,200 units, bringing effective rent to $1,650. Class B at $1,800 can't compete. So Class B cuts. Then Class C follows. The whole market reprices. The pipeline: ~50,000 units were permitted at peak. Permits have since fallen 50% — the last 12 months show 8,263 units, down from 15,000-18,000 annually in 2021-2023. Of that 50K pipeline, 20,000+ likely won't break ground. No lender is financing speculative multifamily at 8.8% vacancy and rents down 9%. The problem is what's already under construction: roughly 15,000-20,000 units will still deliver through mid-2027 regardless of new starts. Recovery math: Denver has ~32,900 vacant units against a healthy-market baseline of ~18,700. That's 14,200 units to absorb. At ~1,200 new renter households per month, that's 12 months on existing excess alone — before accounting for the supply still coming. Equilibrium is late 2027 or early 2028 if demand holds. Later if it doesn't. For investors: Stabilized Class B/C is priced attractively right now. Supply is decelerating, fundamentals are intact, and rent growth returns to older stock first once the pipeline clears. New construction is a different bet. Underwrite 3 years of flat-to-negative rent growth at 85-90% occupancy. Only viable with a balance sheet that can wait. For landlords already operating: retention is worth more than new leases right now. In-place rents are down 2% while asking rents are down 9%. Every tenant you keep is worth 7 points of spread. The 2009 comparison is instructive for what this isn't: that correction required economic recovery. This one just requires time. Check out / interact with RealAI's analysis here: app.realai.com/analysis/publi…
Denver experienced its highest multifamily vacancy rate in 16 years - 7.6%. At the end of last year, about 34,200 units were vacant. Colorado’s population growth is beginning to slow and a wave of new multifamily units have come on the market. Even more supply is in the

According to @GetRealAI's data, #Denver's multifamily vacancy hit 8.8% in January 2026, up from 5.7% in July 2024. That's a 16-year high — last seen during the financial crisis. But this isn't a demand problem. Median household income is $154K (98th percentile nationally). FICO averages 727. Jobs grew 1% year-over-year. Denver overbuilt, badly. The numbers: Between July 2024 and January 2026, Denver added 73,635 multifamily units — a 38% increase in total stock in 18 months. Occupancy fell from 94.3% to 91.2%. Asking rents dropped 9.2%, from $2,072 to $1,881. New lease trade-outs are running negative $76. The cascade works like this: Class A landlords offer 2-3 months free on $2,200 units, bringing effective rent to $1,650. Class B at $1,800 can't compete. So Class B cuts. Then Class C follows. The whole market reprices. The pipeline: ~50,000 units were permitted at peak. Permits have since fallen 50% — the last 12 months show 8,263 units, down from 15,000-18,000 annually in 2021-2023. Of that 50K pipeline, 20,000+ likely won't break ground. No lender is financing speculative multifamily at 8.8% vacancy and rents down 9%. The problem is what's already under construction: roughly 15,000-20,000 units will still deliver through mid-2027 regardless of new starts. Recovery math: Denver has ~32,900 vacant units against a healthy-market baseline of ~18,700. That's 14,200 units to absorb. At ~1,200 new renter households per month, that's 12 months on existing excess alone — before accounting for the supply still coming. Equilibrium is late 2027 or early 2028 if demand holds. Later if it doesn't. For investors: Stabilized Class B/C is priced attractively right now. Supply is decelerating, fundamentals are intact, and rent growth returns to older stock first once the pipeline clears. New construction is a different bet. Underwrite 3 years of flat-to-negative rent growth at 85-90% occupancy. Only viable with a balance sheet that can wait. For landlords already operating: retention is worth more than new leases right now. In-place rents are down 2% while asking rents are down 9%. Every tenant you keep is worth 7 points of spread. The 2009 comparison is instructive for what this isn't: that correction required economic recovery. This one just requires time. Check out / interact with RealAI's full analysis here: app.realai.com/analysis/publi…
Turning this migration and demographic trends analysis (app.realai.com/analysis/publi…) into an interactive comparison tool took @GetRealAI less than 3 minutes.
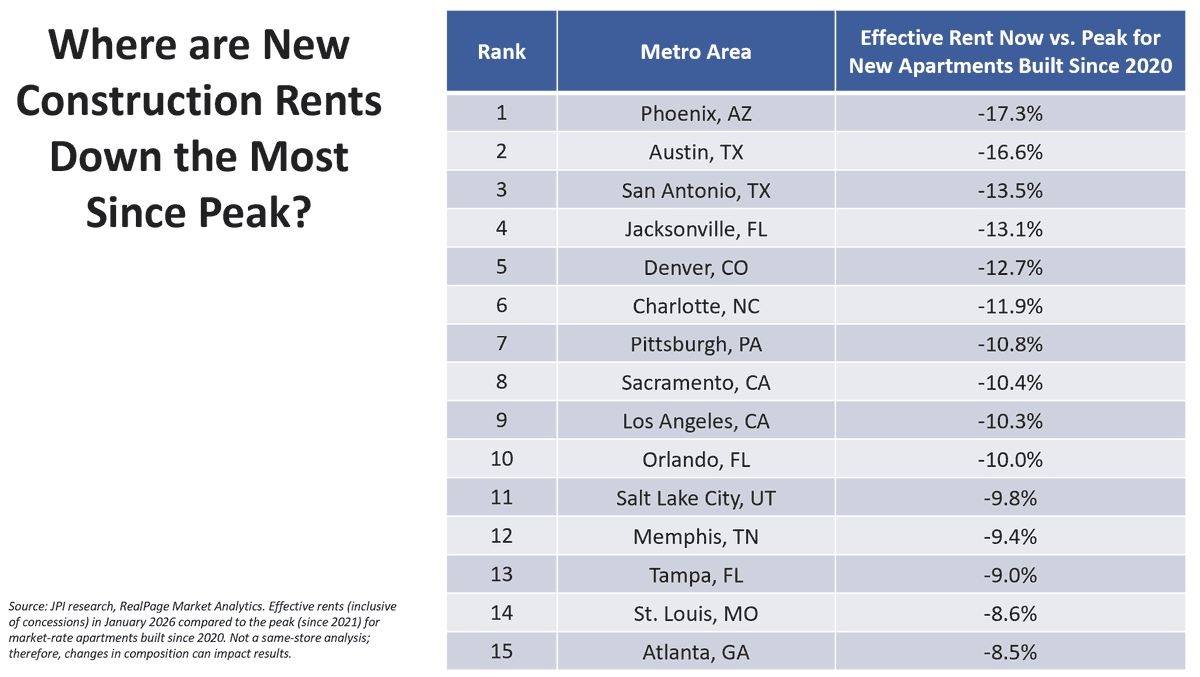
New construction is taking the hardest hit, and it's not a mystery why (according to @GetRealAI's data). Developers need to fill buildings fast to cover debt service, so they lead with concessions — 2-3 months free is now standard in Phoenix, Austin, Charlotte. New units also carried 20-30% premiums over older stock when markets were tight; that premium disappears first when demand softens. And new supply clusters in the same submarkets: downtown Austin, Tempe, South End Charlotte. Metro-wide vacancy can look manageable while specific pockets are in freefall. Pittsburgh, Sacramento, LA, Memphis, St. Louis are a different case. They didn't overbuild by Sunbelt standards, but they didn't add jobs or households fast enough to absorb even modest supply. A 2,000-unit pipeline hits Memphis harder than 10,000 units hits Nashville when Memphis is only adding 500 renter households a year. The cascade most people miss: when Class A asking rents drop 10-15%, Class B can't hold pricing. A tenant paying $1,800 for a 10-year-old unit sees a brand-new unit at $1,900 with three months free — effective rent $1,425. Class B matches the concession or loses the tenant. Then Class C follows. The whole market reprices, and older stock has no amenity upgrade to offer. They cut to effective rents that barely cover expenses. So what's the recovery timeline? Starts are down 40-50% in most of these markets, but buildings started in 2022-2023 are still delivering through mid-2026. Phoenix, Austin, and Charlotte each have 15,000-25,000 units in the pipeline. Even with zero new starts today, new supply keeps arriving for another 18-24 months. Recovery starts when net absorption exceeds completions. In strong job markets — Austin, Denver, Phoenix — that's late 2026 or early 2027. Pittsburgh, Memphis, St. Louis could be 2028 or later. Stabilized Class B/C in these markets is attractively priced. Class A has been absorbing the correction; once the pipeline clears, older well-located buildings become the value proposition. Rent growth returns there first. New construction and lease-up deals require underwriting 2-3 years of negative rent growth at 85-90% occupancy. The balance sheet has to survive the wait — most can't. Supply normalization is mechanical; the pipeline is finite. Demand recovery isn't. If Austin's tech hiring stays flat, if Phoenix slows in-migration, if Charlotte's financial sector plateaus, these markets stay soft even after construction stops. Job growth and household formation tell you more than permit counts. Supply resolves on its own schedule. Demand has to be earned.
Love this data from @jayparsons. New construction is taking the hardest hit, and it's not a mystery why (according to @GetRealAI's data). Developers need to fill buildings fast to cover debt service, so they lead with concessions — 2-3 months free is now standard in Phoenix, Austin, Charlotte. New units also carried 20-30% premiums over older stock when markets were tight; that premium disappears first when demand softens. And new supply clusters in the same submarkets: downtown Austin, Tempe, South End Charlotte. Metro-wide vacancy can look manageable while specific pockets are in freefall. Pittsburgh, Sacramento, LA, Memphis, St. Louis are a different case. They didn't overbuild by Sunbelt standards, but they didn't add jobs or households fast enough to absorb even modest supply. A 2,000-unit pipeline hits Memphis harder than 10,000 units hits Nashville when Memphis is only adding 500 renter households a year. The cascade most people miss: when Class A asking rents drop 10-15%, Class B can't hold pricing. A tenant paying $1,800 for a 10-year-old unit sees a brand-new unit at $1,900 with three months free — effective rent $1,425. Class B matches the concession or loses the tenant. Then Class C follows. The whole market reprices, and older stock has no amenity upgrade to offer. They cut to effective rents that barely cover expenses. So what's the recovery timeline? Starts are down 40-50% in most of these markets, but buildings started in 2022-2023 are still delivering through mid-2026. Phoenix, Austin, and Charlotte each have 15,000-25,000 units in the pipeline. Even with zero new starts today, new supply keeps arriving for another 18-24 months. Recovery starts when net absorption exceeds completions. In strong job markets — Austin, Denver, Phoenix — that's late 2026 or early 2027. Pittsburgh, Memphis, St. Louis could be 2028 or later. Stabilized Class B/C in these markets is attractively priced. Class A has been absorbing the correction; once the pipeline clears, older well-located buildings become the value proposition. Rent growth returns there first. New construction and lease-up deals require underwriting 2-3 years of negative rent growth at 85-90% occupancy. The balance sheet has to survive the wait — most can't. Supply normalization is mechanical; the pipeline is finite. Demand recovery isn't. If Austin's tech hiring stays flat, if Phoenix slows in-migration, if Charlotte's financial sector plateaus, these markets stay soft even after construction stops. Job growth and household formation tell you more than permit counts. Supply resolves on its own schedule. Demand has to be earned.
Where have rents for NEW apartments fallen most? Here's the top 15. We're comparing today's effective rent (with concession included) versus the peak for market-rate apartments built since 2020. The deeper that decline, the longer it'll potentially take for a rent rebound -- not
Here's the underlying analysis: app.realai.com/analysis/publi… Tap "Create" at the bottom to turn it into practically anything you can imagine.
Here's an interactive data visualization tool for understanding FICO vs. Rents in Dallas, Texas—completely developed by @GetRealAI in <5 minutes.
@GetRealAI This is incredible. Thank you!
@juliusmarchi You should consider using @GetRealAI for research and analysis. It's completely free to try and utilizes 3.5T real estate datapoints + latest AI models.
@AdamHKlein We would love to have you try out @GetRealAI and give us feedback. Here's an example of an interactive dashboard that one of our users created in just a few minutes based on analysis they conducted within RealAI using our database of 3.5T datapoints and latest AI models.
If you'd like to see something like this built for one of your properties, shoot us a DM and we'll create it for you.
A @GetRealAI user produced this interactive pro forma dashboard, including gathering and verifying all of the underlying data, in less than 5 minutes and without ever leaving the RealAI platform.
Run any analysis you want, then use the "Create" button at the bottom of the analysis. The interactive dashboard example was created by asking RealAI to create an interactive pro forma dashboard as a .html file, then the file type "Other" was chosen. RealAI produced the file and then it was opened in a browser (as seen in the video above). You can get as specific as you want with style / format preferences.

Edward F Doyle @EdwardFDoyle1
2 Followers 8 Following
Ryan Goldfarb @AreTeePharb
355 Followers 1K Following NYC | NJ - STRs | Real Estate Investor🏡 | Podcaster 🎤 | UMD '13🐢 | Liberty Hudson Capital | Brick x Brick Podcast
LivinginDallas-FortWo... @DFWREAdvisors
476 Followers 2K Following DFWREAdvisors Group - Real Estate Advisors | REALTORS® Serving Buyers, Sellers & Investors Across Dallas-Fort Worth! https://t.co/lyORmBg50g
Armani Altman @AltmanArma60904
3 Followers 75 Following
Liam Lauzon @DisneyxDude
235 Followers 526 Following

LizzyBee @jimmy64carpente
3 Followers 30 Following I love exploring new places and experiencing local cultures 🌍✨. In my downtime, I’m usually reading or binge-watching shows 📚📺
Martin Cortez @MartinC08024661
11 Followers 110 Following
TheStolenTurnip @TheStolenTurnip
15 Followers 2K Following
Carson5500 @Carson55001
3 Followers 94 Following
Jayson𐤊 @jaysonhu2018
29K Followers 6K Following Core Contributor of PFR Capital 猪脚饭资本核心志愿者 情感动作博主 Not Financial Advice 不做投资建议

The wolf of backblock... @CoachGetwright
280 Followers 3K Following Defendself specialist 🦾 , CRYPTO hodler🦺 longterm opportunist 👑 DCA.
David Guidry @guidr55
6 Followers 18 Following
godkinghades @Javarous5
22 Followers 216 Following

Brian Chunn @BrianChunn1
269 Followers 908 Following
josf.k @jos_fk
13 Followers 96 Following
Geoff @gsealander8
0 Followers 5 Following
Fundrise @fundrise
23K Followers 2K Following Fundrise is your path to the private markets, including real estate, venture capital, and private credit. Disclosure: https://t.co/JMPglCFgpA
Spike @michaelk1028
24 Followers 680 Following
John Currin @Jmcurrin
57 Followers 473 Following
nadi @NadiHaque
101 Followers 740 Following ex-data guy building stuff. just talking about stuff I’m interested in made in new england 🇺🇸
Dallas Lightner @dallaslightner
110 Followers 2K Following
Eric Sitman @Esitman
110 Followers 586 Following

Pend @sklinepm
422 Followers 4K Following
Andrew Makrides @drewmakrides
104 Followers 334 Following
M Ahmed @MAhmed17431
0 Followers 7 Following

Rob Shallenberger @sirshalleyii
17 Followers 865 Following
Ghunoo @ghunoo
190 Followers 3K Following Part time writer, 💯 dreamer, Daughter of amazing human beings
BLJW @BLJDub
74 Followers 1K Following
Colton Fairchild @coltonfairchild
131 Followers 982 Following
Sam Kilic @Sam_KilicRE
188 Followers 1K Following

Lake Park Investors, ... @lakeparkinvest
135 Followers 587 Following Commercial Real Estate Capital Advisory
Nightingale Associate... @FCNightingale
34K Followers 17K Following Management consulting, training and speaking. Focus: leadership, management, strategy, motivation and achievement. Completed projects in 40 countries.
Carly Wagenbach @carlytatewags
1 Followers 532 Following PR + Comms @Fundrise Disclosures: https://t.co/Fufdw2UBnQ


Gradually 👉 Sudden... @gradual_sudden_
218 Followers 2K Following Data 📊 & Finance 📈 by day, Art 🖼 & Science 🧫 by night; Finding long-term investment waves to ride-Gradually then Suddenly 🌊
Nicholas John @nicholasbeganjr
258 Followers 547 Following CONTRACTOR • NICHOLAS JOHN REAL ESTATE & CONSTRUCTION | REAL ESTATE BROKER • KELLER WILLIAMS GREATER METROPOLITAN
Nathan S. Robinson @NathanSRobinson
4K Followers 3K Following I post about building software, RE, AI, & architecture Building the Commercial Real Estate industy's AI for zoning analysis, prospecting, and site selection
Austin Thompson, Redf... @austintrealtor
306 Followers 463 Following Senior Premier Agent, Redfin Louisiana Rocket Companies 504-225-4043 [email protected] Get Preapproved with Rocket Today! https://t.co/u7JHl1DmBV
High Point Wealth @HighPointWM
15 Followers 466 Following High Point Wealth | Personal Financial Education with 20+ years of expertise. We simplify the complex so you can reach your financial peak. 📈⛰️
NoTime @akshar1992
18 Followers 69 Following
Benjamin Miller @BenMillerise
11K Followers 965 Following @Fundrise, $VCX, Co-Founder and CEO. Disclosures: https://t.co/JSVDJ9W7Wd https://t.co/qkf3tWylUQ https://t.co/8lYnOMEceQ

Julie Chang @JulieChangRE
23K Followers 2K Following I run a real estate market feasibility and demand study business. DRE 01978767
Jake @JakehellerAI
6K Followers 582 Following 3rd-gen CRE developer | Founder AI for CRE Collective | AI for CRE Media
Nightingale Associate... @FCNightingale
34K Followers 17K Following Management consulting, training and speaking. Focus: leadership, management, strategy, motivation and achievement. Completed projects in 40 countries.
Bobby Fijan @bobbyfijan
93K Followers 7K Following Co-Founder @americanhousing | Building Rowhomes for Families | Signal: Bfijan.19 | Podcast: Why We Don't Build Apartments for Families
Realtor.com @realtordotcom
295K Followers 558 Following Your go-to source for real estate news, housing insights, celebrity real estate, and more from https://t.co/myGAfBr557.
Adam H. Klein | Selli... @AdamHKlein
2K Followers 726 Following Co-founder & broker @ Vision REA selling & leasing CRE props in FL. Posts about CRE, the ‘markets’, family & my own dry humor. Posts are NEVER advice #retwit ✡️
Michael Hamilton @michael____alan
2K Followers 654 Following Co-Founder @ Seneca Development Company. Specializing in multifamily, senior care and mixed-use development.
John Downs @AdvisorJohn
6K Followers 1K Following DC-Baltimore Metro Mortgage Banker 🏠Housing Data, Opinions🏘️ Discussion Topics: Markets, Investing, Fitness, Business Passionate Girl Dad & Husband
Sam ⚔️ Financial ... @financialsamura
40K Followers 1K Following Dad, writing about financial independence (FIRE) since 2009 https://t.co/CXfRynQFt7
David Ellebrecht @davidellebrecht
5K Followers 2K Following
Barrett Linburg @DallasAptGP
111K Followers 1K Following Creating investor returns & revitalizing Opportunity Zones | Co-Founder @ SavoyEquity | $240M+ transforming TX neighborhoods | Proven tax-advantaged model
Casey Mericle @CaseyMericle
35K Followers 2K Following Real Estate Degenerate. Opinions are free the foolishness you’ll pay for. DM like you own the place.
Random Walk @MosesSternstein
3K Followers 2K Following Idea Alpha https://t.co/l3xJa5ebPY Making capital markets interesting again Wide but not deep, but still deeper than most.
Julius @juliusmarchi
13K Followers 538 Following Built & sold a pressure washing company | Growth Consultant @strykerdigital | Investing in RE
theficouple @theficouple
104K Followers 227 Following $100,000 of debt → financially free in our early 30's Real estate & personal finance No hype. Just proven strategies 👉🏻Build wealth faster with @tryhellofi
Joe Weisenthal @TheStalwart
443K Followers 7K Following One half of Bloomberg's Odd Lots Podcast. One quarter of Light Sweet Crude.
Jay Parsons @jayparsons
31K Followers 361 Following Rental housing economist, Dad x5 and suffering Cowboys fan ... Rental housing is essential, misunderstood and we need more of it.
Charlie Bilello @charliebilello
791K Followers 143 Following Chief Market Strategist @ Creative Planning Investor | Writer | Reader | Thinker Trying to become a little wiser every day.
Michael @MichaelLagazo
22K Followers 12K Following Commercial Real Estate, MBA, @ICSC. Life is a lease. Negotiate well. // Alum: @urw_group, @Brkfldproprtl, @FourSeasons, @NFL GSIS, @USArmy 🇺🇸
Lance Lambert @NewsLambert
106K Followers 2K Following Analyzing the housing market through a local lens 🏡 📊 CEO of @ResidentialClub. Subscribe to ResiClub's housing market research 👇
ResiClub 🏡📊 @ResidentialClub
17K Followers 3 Following Your data-driven gateway to the heart of the U.S. housing market. An independent news and research firm that covers the housing market. 🏡📊
The Kobeissi Letter @KobeissiLetter
2.0M Followers 630 Following Official X account for The Kobeissi Letter, an industry leading commentary on the global capital markets. Email us: [email protected]
Rick Palacios Jr. @RickPalaciosJr
42K Followers 670 Following Director of Research | John Burns Research & Consulting @JBREC | Previously @MorganStanley & @MilkenInstitute | All things housing
Benjamin Miller @BenMillerise
11K Followers 965 Following @Fundrise, $VCX, Co-Founder and CEO. Disclosures: https://t.co/JSVDJ9W7Wd https://t.co/qkf3tWylUQ https://t.co/8lYnOMEceQ
Fundrise @fundrise
23K Followers 2K Following Fundrise is your path to the private markets, including real estate, venture capital, and private credit. Disclosure: https://t.co/JMPglCFgpATrends for United States
You might like